economy · 2026-07-09
IMF Cuts Global Growth as Iran War Drags
6d0a066a-2227-4d24-9d44-75f426400000
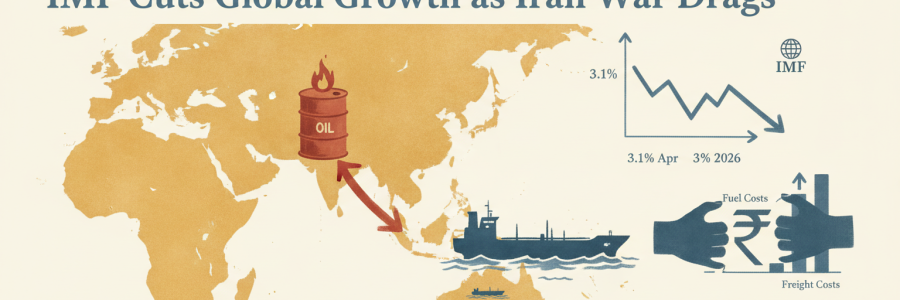
IMF lowered 2026 global growth forecast to 3%, down from 3.1% in Apr, its second downgrade this year, citing energy shock from the US-Israel war on Iran.Brent crude jumped ~7% to $79/barrel after the US resumed strikes on Iran, with Strait of Hormuz transits down to 41/day from ~130 pre-war, threatening India's oil supply route.India imports ~85% of its crude, much via Hormuz. Higher oil prices widen the trade deficit, push up fuel and freight costs, and pressure the rupee for Indian consumers and businesses.
What does the IMF's revised forecast assume?
The IMF's 3% growth projection assumes the Strait of Hormuz begins reopening by mid-Jul 2026 and returns to pre-war conditions by Mar 2027. It also factors in an AI-driven investment boom partly offsetting the energy shock. Deputy research director Petya Koeva Brooks acknowledged overnight US strikes on Iran illustrate the forecast's fragility.
Why did the IMF downgrade twice this year?
The first cut came in Apr, trimming 2026 growth from 3.3% to 3.1% after Iran initially disrupted Hormuz shipping. The second, to 3%, reflects the war's persistence. Each downgrade signals that the energy shock lasted longer than models assumed. The IMF's 2024-25 growth average was 3.5%, so 3% marks a meaningful deceleration.
What does 'pre-war state' by Mar mean?
Pre-war, Hormuz handled roughly one-fifth of global oil and LNG trade, with ~130 daily transits. Returning to that state means insurance premiums on tanker routes normalizing, convoy escort requirements ending, and shipping firms resuming standard schedules. For comparison, after the 2019 tanker attacks, full normalization took about four months once tensions subsided.
How does AI demand offset the energy shock?
The IMF highlights a technology-driven investment boom, especially in AI infrastructure. Companies like Microsoft and Google are spending $50Bn+ annually on data centers and chips. This capital expenditure creates demand for construction, energy, and semiconductors, partially compensating for the drag from higher oil prices. The net effect still leaves growth below its 2024-25 trend.
How fragile is the Hormuz ceasefire for oil?
Oil markets priced in a best-case ceasefire that rested on little more than a high-level MOU, per analyst Fabien Yip at IG Sydney. Brent crude jumped from ~$71 to ~$79/barrel in days after the US resumed strikes. Hormuz transits collapsed to 41/day, roughly one-third of the pre-war ~130. Any further escalation could push crude back toward its earlier spike, keeping risk premiums elevated.
Could Brent spike back above $90/barrel?
During the initial Hormuz disruption earlier in 2026, Brent briefly topped $90. Analyst Fabien Yip at IG notes a full repeat looks less likely now because strategic petroleum reserves have been partially deployed and OPEC+ has signaled spare capacity. But if Iran fully blocks the strait, the $90+ scenario returns quickly.
Why did markets trust a fragile MOU?
Oil traders had financial incentive to assume the best case. Short positions against crude were profitable as prices fell to pre-war levels last week. The US-Iran MOU lacked enforcement mechanisms, essentially a political handshake. Markets often treat ceasefires as binary, pricing in peace until proven wrong, then overcorrecting. This pattern repeated in the 2022 Russia-Ukraine grain deal collapse.
How do refiners hedge against price swings?
Indian refiners like Indian Oil and BPCL use futures contracts on exchanges like ICE and NYMEX to lock in crude prices months ahead. They also diversify sourcing, buying from Russia, Saudi Arabia, and the US. However, hedging covers only a fraction of total volume. Reliance's Jamnagar refinery, the world's largest, maintains roughly 15-20 days of crude inventory as a physical buffer against supply shocks.
Which economies gain or lose most from this?
The US leads advanced economies at 2.3% growth, partly shielded by domestic energy production. Japan trails at 0.6%. China is forecast at 4.6%. India, though not named, faces outsized exposure. It imports ~85% of crude, and every $10/barrel rise in Brent adds roughly $15Bn to India's annual import bill, pressuring the current account deficit and the rupee.
Is India more exposed than other importers?
India imports ~85% of its crude, more than China (~72%) or Japan (~97%, but Japan's economy is smaller and less energy-intensive per unit of GDP growth). India's refining capacity is also tilted toward Middle Eastern crude grades. Reliance and BPCL have configured refineries for heavier, sour crude from the Gulf, making rapid source-switching costlier than for refiners in South Korea or Singapore.
Which Indian sectors feel oil spikes first?
Airlines and trucking absorb oil spikes first because fuel is 35-40% of operating costs for carriers like IndiGo. Petrochemical firms such as Haldia Petrochemicals see feedstock costs rise within weeks. Fertilizer producers like IFFCO face costlier natural gas imports. Consumers feel it last, through higher LPG, diesel, and petrol prices, typically with a 2-4 week lag as OMCs adjust pump rates.
Could India use reserves to cushion prices?
India's Strategic Petroleum Reserve holds ~39 million barrels across Visakhapatnam, Mangalore, and Padur. At current consumption of ~5.5 million barrels/day, that covers roughly one week. By comparison, the US SPR holds ~400 million barrels, covering ~20 days. India's reserves can soften a brief spike but cannot absorb a prolonged Hormuz closure. The govt has approved expanding SPR capacity to ~67 million barrels, but construction is ongoing.
Source: aljazeera.com