economy · 2026-06-17
Tamil Nadu's Debt Hits ₹13.18L Cr
82092edf-4ece-494a-b6b5-f40fbec1f72a
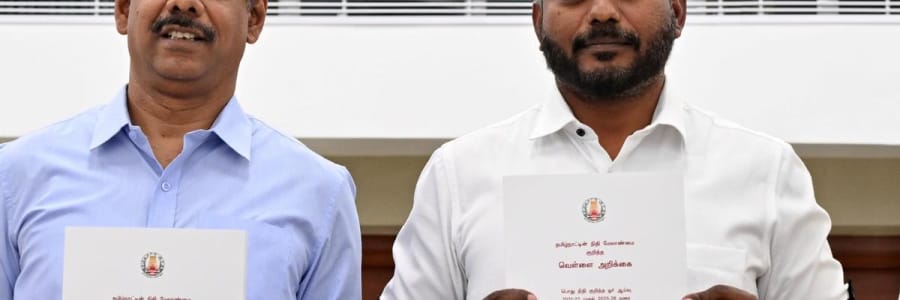
TVK govt releases White Paper pegging Tamil Nadu's total debt at ₹13.18 lakh crore, spotlighting fiscal stressThe document aims to establish a baseline for the new govt's financial position and signal accountability for inherited liabilitiesWhite Papers are a common political tool used by incoming govts to frame the fiscal narrative around predecessor spending
Why do new govts release White Papers?
Incoming govts use White Papers to publicly document the fiscal mess they inherit. It sets a political baseline, letting voters judge future performance against a stated starting point. [TVK's White Paper pegs Tamil Nadu debt at ₹13.18L Cr], framing prior AIADMK/DMK spending as a key cause.
How do other states use White Papers?
Several states have used this tactic. [Karnataka's Congress govt released one in 2023] after unseating the BJP. [Rajasthan and Madhya Pradesh] have done similarly. Each aims to anchor public perception that inherited finances were mismanaged, creating political cover for tough decisions.
What political purpose does timing serve?
Releasing it early in the term maximizes impact. Voters are most receptive to blaming predecessors immediately after an election. [TVK, led by Vijay], wants the narrative set before its first full budget so any austerity measures or borrowing appear justified by inherited conditions.
Can a White Paper change fiscal policy?
White Papers themselves carry no legal force. They are political documents. However, they can build public support for [spending cuts or new taxes] by framing them as necessary corrections. They also signal to rating agencies and bond markets that the new govt acknowledges fiscal realities.
How does this debt level affect Tamil Nadu?
A debt of ₹13.18L Cr means higher interest payments competing with welfare spending. Tamil Nadu's annual budget is roughly [₹3.5-4L Cr], so debt exceeds 3x annual revenue. This limits room for new schemes on healthcare, education, and infrastructure without borrowing even more.
What does ₹13.18L Cr mean for services?
Interest payments on this debt could consume [~15-18% of revenue receipts], crowding out spending on schools and hospitals. Tamil Nadu runs large welfare programs like [free bus passes and rice subsidies]. Sustaining them alongside rising debt servicing costs forces hard trade-offs.
Will Tamil Nadu's credit rating be hit?
Rating agencies like [ICRA and CRISIL] assess state finances regularly. Tamil Nadu has historically maintained a stable rating, but if debt grows faster than GSDP, downgrades become possible. A downgrade would raise borrowing costs, creating a [negative spiral of costlier debt].
How does this compare to other big states?
Among large states, [Maharashtra's debt is ~₹7L Cr] and [Uttar Pradesh's is ~₹7.5L Cr]. Tamil Nadu's ₹13.18L Cr figure looks high, but its economy is also larger per capita. The meaningful comparison is debt-to-GSDP, where Tamil Nadu sits closer to the national average for states.
What do the numbers actually reveal?
Tamil Nadu's debt-to-GSDP ratio likely sits around [~30%], which is near the FRBM limit states are expected to maintain. For context, states like [Punjab and Kerala] carry even higher ratios. The White Paper likely breaks down how much debt accumulated in the last 5 years versus before.
How is Tamil Nadu's debt split by source?
Most state debt comes from [market borrowings via SDLs], which carry market-linked interest rates. A portion also comes from [central govt loans and NSSF]. The mix matters because SDL rates are higher, so a shift toward market borrowing raises overall servicing costs.
What portion is off-budget borrowing?
Off-budget borrowing through [state PSU guarantees and SPV debt] is a growing concern nationally. The White Paper likely highlights guarantees extended by entities like [TANGEDCO], Tamil Nadu's power utility. These don't show in headline debt figures but represent real contingent liabilities.
Has Tamil Nadu's debt doubled recently?
Tamil Nadu's debt was roughly [₹4.85L Cr in 2019-20] before the pandemic. The jump to ₹13.18L Cr reflects pandemic-era borrowing surges, revenue shortfalls, and continued welfare spending. That is nearly a [2.7x increase in ~6 years], a pace well above pre-Covid trends.
Source: thehindu.com